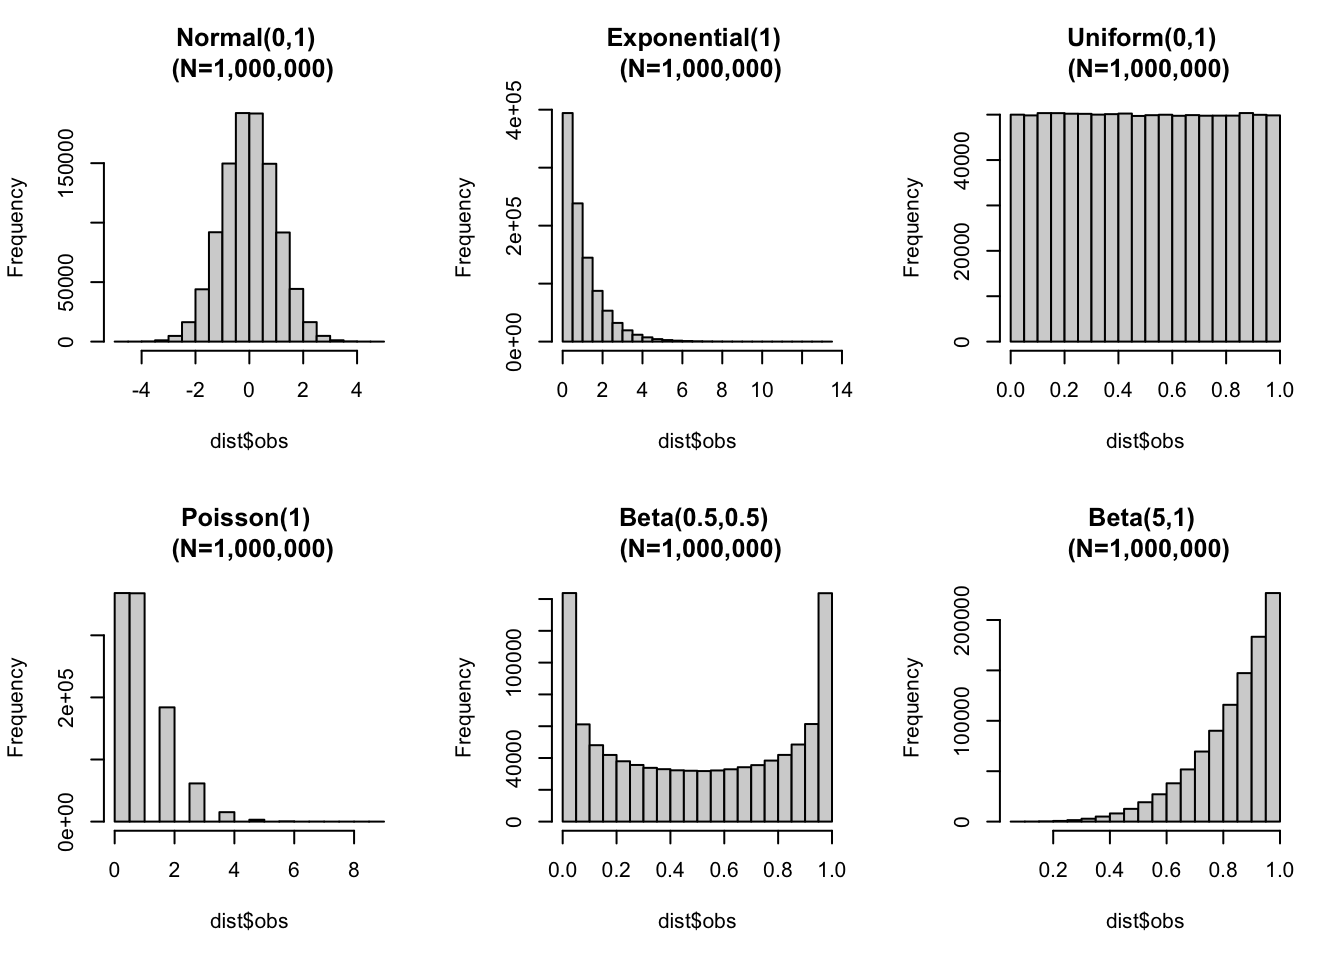
Visualizing the Central Limit Theorem
Simulating different types of data to visualize how the central limit theorem allows us to use the normal distribution in sampling and experimentation.
Experienced data analyst and statistician

Chicago marketer turned Austin statistician
As a seasoned data analyst with a strong foundation in marketing, I leverage my diverse skill set to uncover actionable insights and fuel business growth. A Chicago native and DePaul University graduate, I initially honed my expertise in digital marketing, managing AdWords campaigns and optimizing SEO strategies. Recognizing the transformative power of data, I pursued advanced studies in statistics, earning an M.S. from Texas A&M University in 2022. My ongoing commitment to professional development ensures I remain at the forefront of data science methodologies, enabling me to deliver impactful results in today's data-driven landscape.
Below is a handful of the tools I am most experienced with.
This is only a summary as I am tool-agnostic so long as it makes
sense for the application.
For me this usually means
R for statistical analysis and visualization as R has a great set
of built-in stats functions and Tidyverse makes data viz simple.
For scripting I tend to lean on JS, Bash, or Python.
Sklearn holds the crown for machine learning adoption (and therefore documentation) although I also have experience using Caret
I like to spend my free time building so outside of work I spend a lot of time working on my car, adding onto hobby automations on AWS instances, and expanding my data science skillset through analysis and machine learning. These are a few of the projects I have been working on over the past few years:
Simulating different types of data to visualize how the central limit theorem allows us to use the normal distribution in sampling and experimentation.
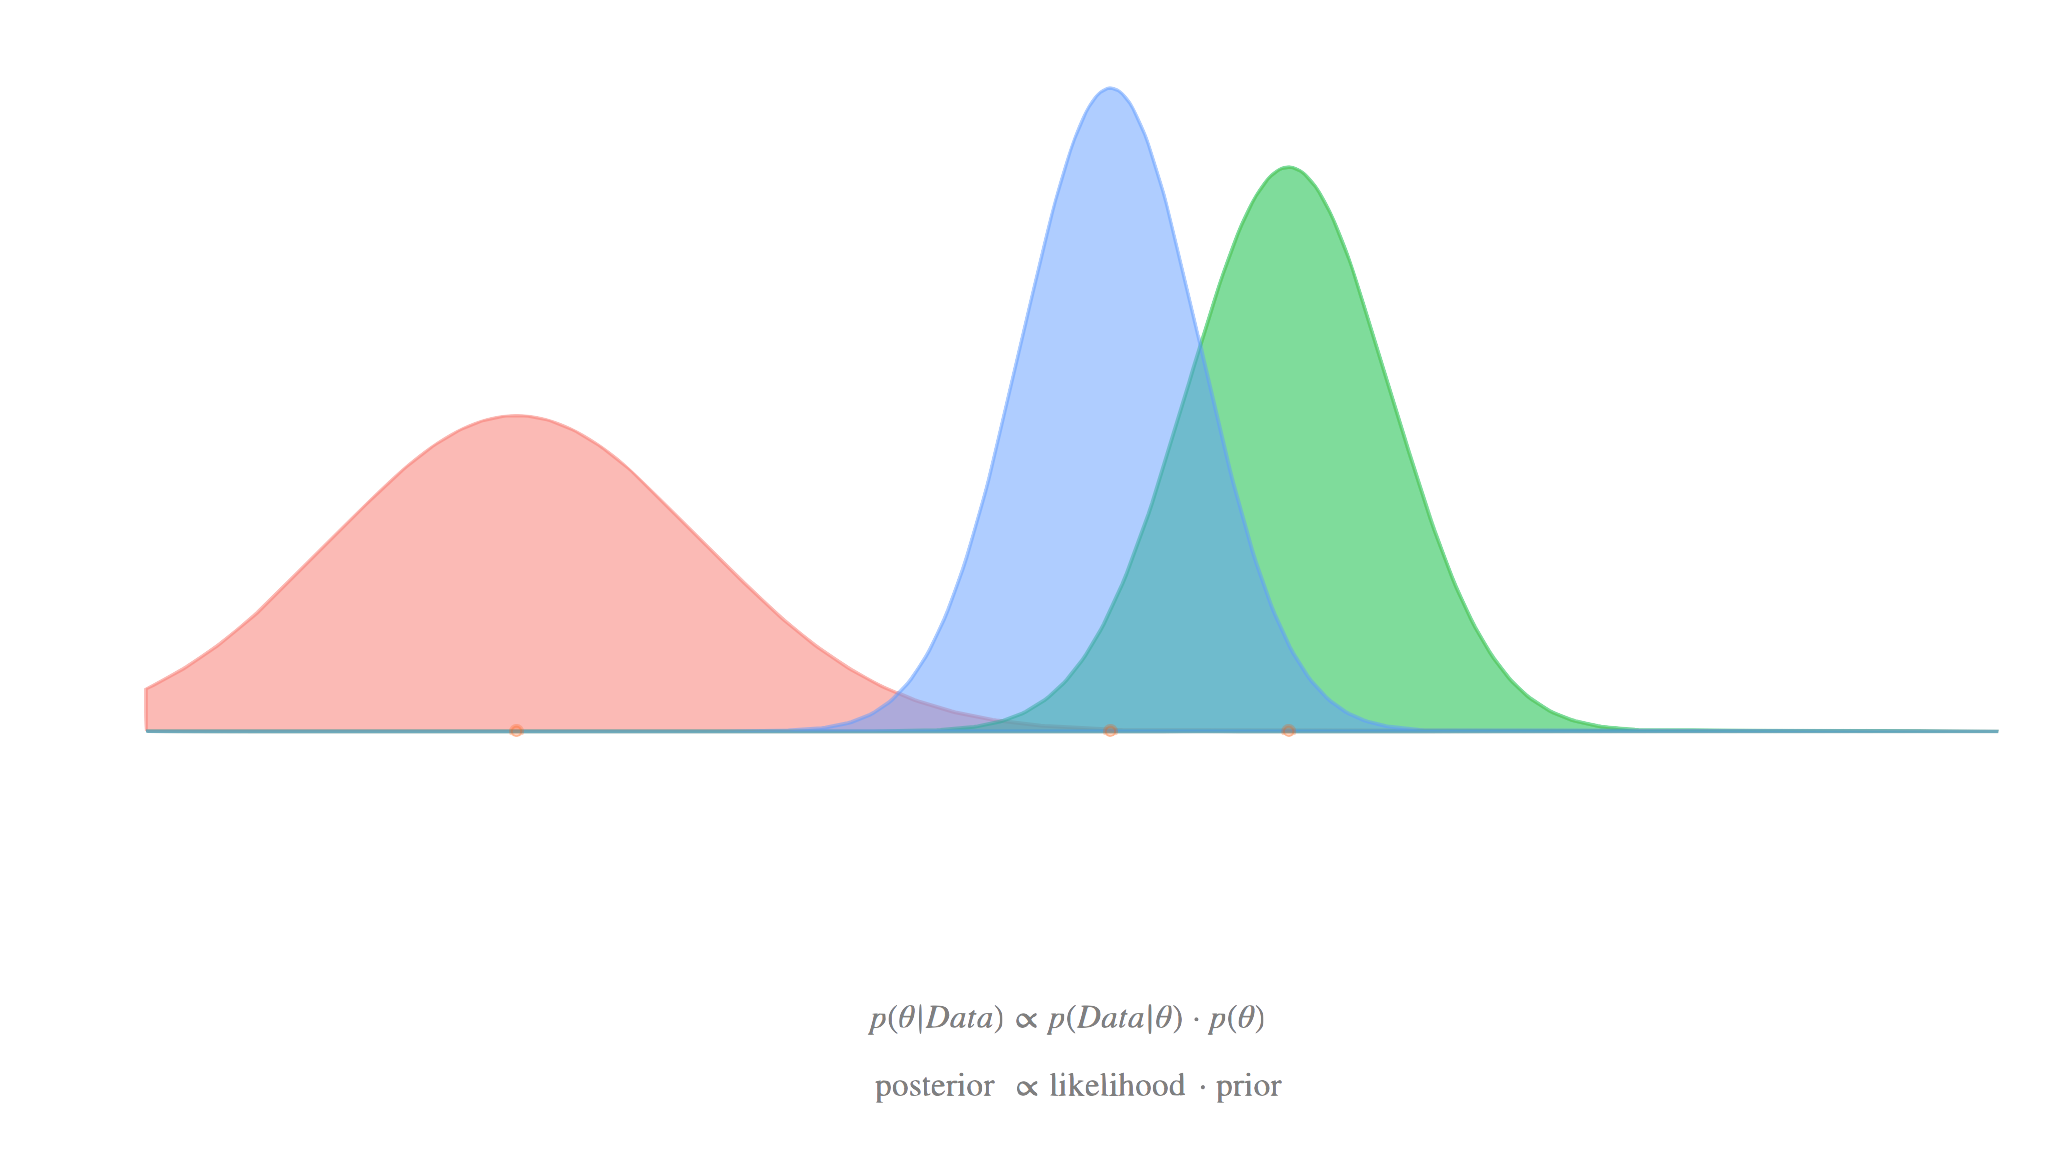
A thorough guide for using Bayesian methods to create mixed models using R.
An increasing portion of StackOverflow questions go unanswered by the year. Using a public dataset, I built a classification model to as one approach to try and solve this problem.

As a gearhead nerd I always wanted to analyze car specs and compare across makes/models. I scraped data of 44,000+ models from 66 vehicle makes, created visualizations to explore historic trends, and used non-linear regression to model 0-60mph times.
Feel free to reach out! I am happy to answer questions about my background or projects, discuss new opportunities, or just talk about cars/data science/anything!